Analytics Platform
Introduction
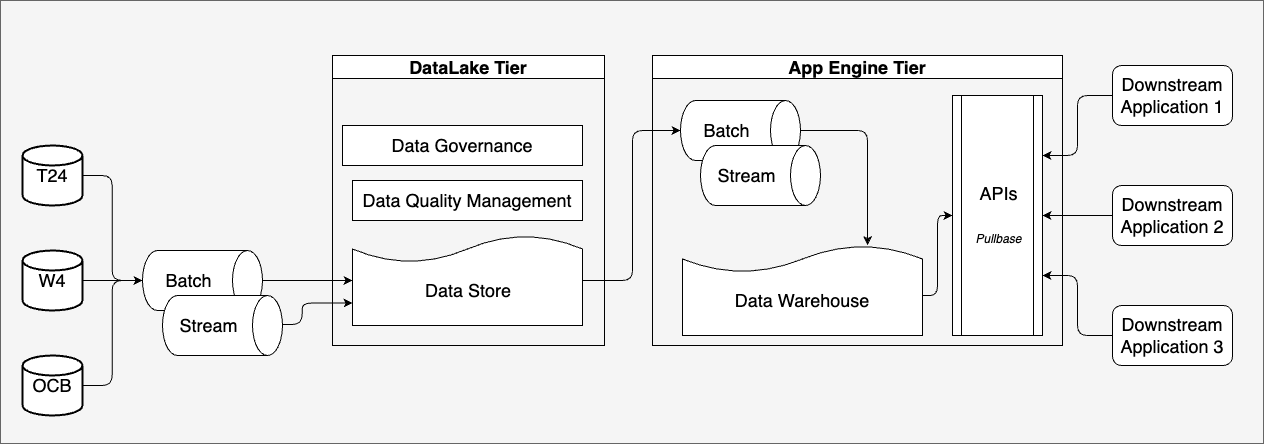
Having the platform split like this turns it into a modular platform with loosely coupled interfaces.
Why is it so important to have a modular platform?
If you have a platform that is not modular you end up with something that is fixed or hard to modify. This means you can not adjust the platform to changing requirements of the company.
Because of modularity it is possible to specifically select tools for your use case. It also allows you to replace every component, if you need it.
The Microservices Architecture is designed and a standard for decoupling the services. Where you can easily create, modify and maintain individual service. Check out here: https://microservices.io/
Example of Data ETL Pipeline, which is patterned for older as well as newer version of data pipeline
%%{init: {
        'theme': 'base',
        'themeVariables': {
            'primaryColor': '#ffffff',
            'primaryTextColor': '#000000',
            'primaryBorderColor': '#666666',
            'lineColor': '#666666',
            'secondaryColor': '#ffffff',
            'tertiaryColor': '#ffffff'
        }
    }}%%
flowchart TD
%% Add a transparent text node as a watermark
style Watermark fill:none,stroke:none
Watermark[Created by: LongBui]
    A[Data Sources] --> |Batching| B[Data Lake]
    A --> |Streaming| C[Message Queue]
    B --> D[ETL Processing]
    C --> E[Stream Processing]
    D --> F[Data Warehouse]
    E --> F
    F --> G[Data Analytics]
    G --> H[Reporting]
    G --> I[Machine Learning Model Training]
    I --> J[Model Deployment]
    J --> K[Model Serving]
    K --> L[Real-time Predictions]
    H --> M[Dashboards]
    M -.-> N[End Users]
    L -.-> N
Figure: Example of Analytics Data Application
Connect
Ingestion is all about getting the data in from the source and making it available to later stages. Sources can be everything from Database, API, server logs to IoT sensor data, streaming, document, apps, files, etc.
Sources send data to your API Services. The API is going to push the data into a temporary storage.
The temporary storage allows other stages simple and fast access to incoming data.
A great solution is to use messaging queue systems like Apache Kafka, RabbitMQ or AWS Kinesis. Sometimes people also use caches for specialized applications like Redis.
A good practice is that the temporary storage follows the publish-subscribe pattern. This way APIs can publish messages and Analytics can quickly consume them.
%%{init: {
        'theme': 'base',
        'themeVariables': {
            'primaryColor': '#ffffff',
            'primaryTextColor': '#000000',
            'primaryBorderColor': '#666666',
            'lineColor': '#666666',
            'secondaryColor': '#ffffff',
            'tertiaryColor': '#ffffff'
        }
    }}%%
flowchart TD
%% Add a transparent text node as a watermark
style Watermark fill:none,stroke:none
Watermark[Created by: LongBui]
    A[Ingestion] --> B[Get data from source]
    B --> C[Database]
    B --> D[API]
    B --> E[Server logs]
    B --> F[IoT sensor data]
    B --> G[Streaming]
    B --> H[Document]
    B --> I[Apps]
    B --> J[Files]
    B --> K[API Services]
    C --> L[Push data to temporary storage]

    D --> L
    E --> L
    F --> L
    G --> L
    H --> L
    I --> L
    J --> L
    K --> L

    L --> M[Temporary storage allows simple and fast access]

    M --> N[Use messaging queue systems]
    M --> O[JDBC, ODBC connection]

    L --> T[Follow publish-subscribe pattern]
    T --> U[APIs publish messages]
    T --> V[Message subscriber]

    B --> S[More...]
Figure: Type of Data Connection and Integration
In different situation, data need to be processed periodically. The batching processes data as the same process with streaming (you can understand batch and micro-batch likes streaming with bigger time window).
Integration
There are several different ways to integrate with data sources, which is depended on what kind of data sources are available such as Database, Object Storage, File System, API, etc.
- ODBC: using Live-connection with driver is very simple way to connect and ingest data.
- File System: using Secret and credential to connect and ingest files
- API: using REST API to pull data from system, remember to refresh token if needed.
Assumptions the network is configured, if not Here are some examples of how to configure the network:
- Site to Point
- Point to Point
- Site to Site
- Internet
- White list
%%{init: {
        'theme': 'base',
        'themeVariables': {
            'primaryColor': '#ffffff',
            'primaryTextColor': '#000000',
            'primaryBorderColor': '#666666',
            'lineColor': '#666666',
            'secondaryColor': '#ffffff',
            'tertiaryColor': '#ffffff'
        }
    }}%%
graph TD
%% Add a transparent text node as a watermark
style Watermark fill:none,stroke:none
Watermark[Created by: LongBui]
    A[Connections] --> B[Site to Point]
    A --> C[Point to Point]
    A --> D[Site to Site]
    A --> E[Internet]
    A --> F[White list]
Figure: Platform Connection List
Buffer
In the buffer phase you have pub/sub systems like Apache Kafka, Redis, or other Cloud tools like Google pub/sub or AWS Kinesis.
These systems are more or less message Queues. You put something in on one side and take it out on the other.
The idea behind buffers is to have an intermediate system for the incoming data and avoid pressing data destination.
- Pub/Sub Systems and Message Queues
%%{init: {
        'theme': 'base',
        'themeVariables': {
            'primaryColor': '#ffffff',
            'primaryTextColor': '#000000',
            'primaryBorderColor': '#666666',
            'lineColor': '#666666',
            'secondaryColor': '#ffffff',
            'tertiaryColor': '#ffffff'
        }
    }}%%
graph TD
%% Add a transparent text node as a watermark
style Watermark fill:none,stroke:none
Watermark[Created by: LongBui]
    A[Buffer Layer] --> B[Pub/Sub Systems]
    B --> C[Apache Kafka]
    B --> D[Redis]
    B --> E[Google Pub/Sub]
    B --> F[AWS Kinesis]

    A --> G[Message Queues]
    G --> H[Put data in one side]
    G --> I[Take data out the other side]
Figure: Type of Data Buffering Connection
- Buffer as Intermediate System and example process
How this works is, for instance you’re getting data in from from an API. The API is publishing into the message queue. Data is buffered there until it is picked up by the processing.
If you don’t have a buffer you can run into problems when writing directly into a store, or you’re processing the data directly. You can always have peaks of incoming data that stall the systems.
Like, it’s lunch break and people are working with your app way more then usually. There’s more data coming in very very fast. Faster than the analytics of the storage can handle.
%%{init: {
        'theme': 'base',
        'themeVariables': {
            'primaryColor': '#ffffff',
            'primaryTextColor': '#000000',
            'primaryBorderColor': '#666666',
            'lineColor': '#666666',
            'secondaryColor': '#ffffff',
            'tertiaryColor': '#ffffff'
        }
    }}%%
graph TD
%% Add a transparent text node as a watermark
style Watermark fill:none,stroke:none
Watermark[Created by: LongBui]
    A[Buffer Layer] --> J[Intermediate System]
    J --> K[Avoid pressing data destination]

    A --> L[Example Process]
    L --> M[API publishes into message queue]
    M --> N[Data buffered until picked up by processing]
Figure: How to buffer data
- Problem without Buffer and benefit of Buffer In this case you would run into problems, because the whole system would stall. It would therefore take long to process the data and your customers would be annoyed.
With a buffer you’re buffering the incoming data. Processes for storage and analytics can take out only as much data as they can process. You are no longer in danger of overpowering systems.
Buffers are also really good for building pipelines.
%%{init: {
        'theme': 'base',
        'themeVariables': {
            'primaryColor': '#ffffff',
            'primaryTextColor': '#000000',
            'primaryBorderColor': '#666666',
            'lineColor': '#666666',
            'secondaryColor': '#ffffff',
            'tertiaryColor': '#ffffff'
        }
    }}%%
graph TD
%% Add a transparent text node as a watermark
style Watermark fill:none,stroke:none
Watermark[Created by: LongBui]
    A[Buffer Layer] --> O[Problems Without Buffer]
    O --> P[Peaks of incoming data can stall systems]
    P --> Q[Example: Lunch break increased app usage]
    Q --> R[More data coming in faster than analytics/storage can handle]
    R --> S[System stalls, processing delays, annoyed customers]

    A --> T[Benefits of Buffer]
    T --> U[Buffers incoming data]
    U --> V[Processes take out only as much data as they can handle]
    V --> W[Prevents system overpowering]

    T --> X[Good for building pipelines]
    X --> Y[Take data out of Kafka, pre-process, put back into Kafka]
    X --> Z[Another analytics process takes processed data and puts into store]
Figure: Why Buffer is important
You take data out of Kafka, you pre-process it and put it back into Kafka. Then with another analytics process you take the processed data back out and put it into a store.
Processing Framework
The analyze stage is where the actual analytics is done. Analytics, in the form of stream and batch processing.
Streaming data is taken from ingest and fed into analytics. Streaming analyzes the “live” data, thus generating fast results.
As the central and most important stage, analytics also has access to the big data storage. Because of that connection, analytics can take a big chunk of data and analyze it.
This type of analysis is called batch processing. It will deliver you answers for the big questions.
To learn more about stream and batch processing read my blog post: Streaming pipeline with AWS services How to Create New and Exciting Big Data Aided Products.
%%{init: {
        'theme': 'base',
        'themeVariables': {
            'primaryColor': '#ffffff',
            'primaryTextColor': '#000000',
            'primaryBorderColor': '#666666',
            'lineColor': '#666666',
            'secondaryColor': '#ffffff',
            'tertiaryColor': '#ffffff'
        }
    }}%%
graph TD
%% Add a transparent text node as a watermark
style Watermark fill:none,stroke:none
Watermark[Created by: LongBui];
    A[Landing] --> B[Batching Data];
    A --> C[Streaming Data];

    B --> D[Staging];
    C --> D;

    D --> E[Warehousing];

    E --> F[Reporting Schema];

    F --> G[Archive];

    H[Pipeline Logging] --> I[Audit Schema];
Figure: Data Warehouse Internals
The analytics process, batch or streaming, is not a one way process. Analytics can also write data back to the big data storage.
Often times writing data back to the storage makes sense. It allows you to combine previous analytics outputs with the raw data.
Analytics give insights when you combine raw data. This combination will often times allow you to create even more useful insights.
A wide variety of analytics tools are available. Ranging from MapReduce or AWS Elastic MapReduce to Apache Spark and AWS lambda.
Understanding the Data Processing Framework will let you better engineering the data
Watch this video for understanding how data being processed in data warehouse
This diagram shows how data processing flows from external source to target data destination
%%{init: {
        'theme': 'base',
        'themeVariables': {
            'primaryColor': '#ffffff',
            'primaryTextColor': '#000000',
            'primaryBorderColor': '#666666',
            'lineColor': '#666666',
            'secondaryColor': '#ffffff',
            'tertiaryColor': '#ffffff'
        }
    }}%%
graph TD
%% Add a transparent text node as a watermark
style Watermark fill:none,stroke:none
Watermark[Created by: LongBui]
    A[Data Processing] --> B[Analyze Stage]
    B --> C[Analytics Stream & Batch]
    C --> D[Streaming Data]
    D --> E[Ingest]
    D --> F[Big Data Storage]

    C --> G[Batch Processing]
    G --> H[Big Data Storage]

    B --> I[Write Data Back]
    I --> F[Big Data Storage]

    B --> J[Analytics Tools]
    J --> K[MapReduce / AWS EMR]
    J --> L[Apache Spark / AWS Lambda]

    B --> M[Learn More]
    M --> N[Blog Post]

    N --> O["Streaming Pipeline with AWS Services"]
    N --> P["How to Create New and Exciting Big Data Aided Products"]
Figure: Data Processing State
This example shows simple lineage of data, meaning that we can determine states of data based layer.
%%{init: {
        'theme': 'base',
        'themeVariables': {
            'primaryColor': '#ffffff',
            'primaryTextColor': '#000000',
            'primaryBorderColor': '#666666',
            'lineColor': '#666666',
            'secondaryColor': '#ffffff',
            'tertiaryColor': '#ffffff'
        }
    }}%%
graph LR
%% Add a transparent text node as a watermark
style Watermark fill:none,stroke:none
Watermark[Created by: LongBui]

    subgraph sub1[Data Source]
        Source
    end
    subgraph sub2[Data Warehouse]
        direction LR
        Landing --> Staging
        Staging --> |1|Dim
        Staging --> |2|Fact
        Dim ==> Agg
        Fact ==> Agg
    end
    sub1 --> sub2 --> Semantic


style sub1 fill:#fefefe,stroke:#333,stroke-width:1px
style sub2 fill:#f0f0f0,stroke:#333,stroke-width:1px
Figure: Dimension Data Loading
Store
This is the typical big data storage where you just store everything. It enables you to analyze the big picture.
Most of the data might seem useless for now, but it is of upmost importance to keep it. Throwing data away is a big no no.
Why not throw something away when it is useless?
%%{init: {
        'theme': 'base',
        'themeVariables': {
            'primaryColor': '#ffffff',
            'primaryTextColor': '#000000',
            'primaryBorderColor': '#666666',
            'lineColor': '#666666',
            'secondaryColor': '#ffffff',
            'tertiaryColor': '#ffffff'
        }
    }}%%
graph TD
%% Add a transparent text node as a watermark
style Watermark fill:none,stroke:none
Watermark[Created by: LongBui]
    A[Big Data Storage] --> B[Store Everything]
    B --> C[Analyze Big Picture]

    A --> D[Keep All Data]
    D --> E[Data Usefulness]
    E --> F[Data Scientists Analyze]

    A --> G[Systems to Store Data]
    G --> H[Hadoop HDFS]
    G --> I[Hbase]
    G --> J[Amazon S3]
    G --> K[DynamoDB]

    A --> L[Store Data in Different Ways]
    L --> M[Object Storage]
    M --> N[Variety of Object Types]
    M --> O[Metadata for Querying]

    L --> P[Lake-house Architecture]
    P --> Q[Modern Data Organization]
Figure: Type of Data Storage
Although it seems useless for now, data scientists can work with the data. They might find new ways to analyze the data and generate valuable insights from it.
What kind of systems can be used to store big data?
Systems like Hadoop HDFS, Hbase, Amazon S3 or DynamoDB are a perfect fit to store big data.
Data can be stored in different ways depending architecture designed.
Object Storage contains verity of object types including data structured, non-structured and semi-structured data. Remember, not-structured data need to have metadata for querying.
Lake-house architecture is modern process to organize data.
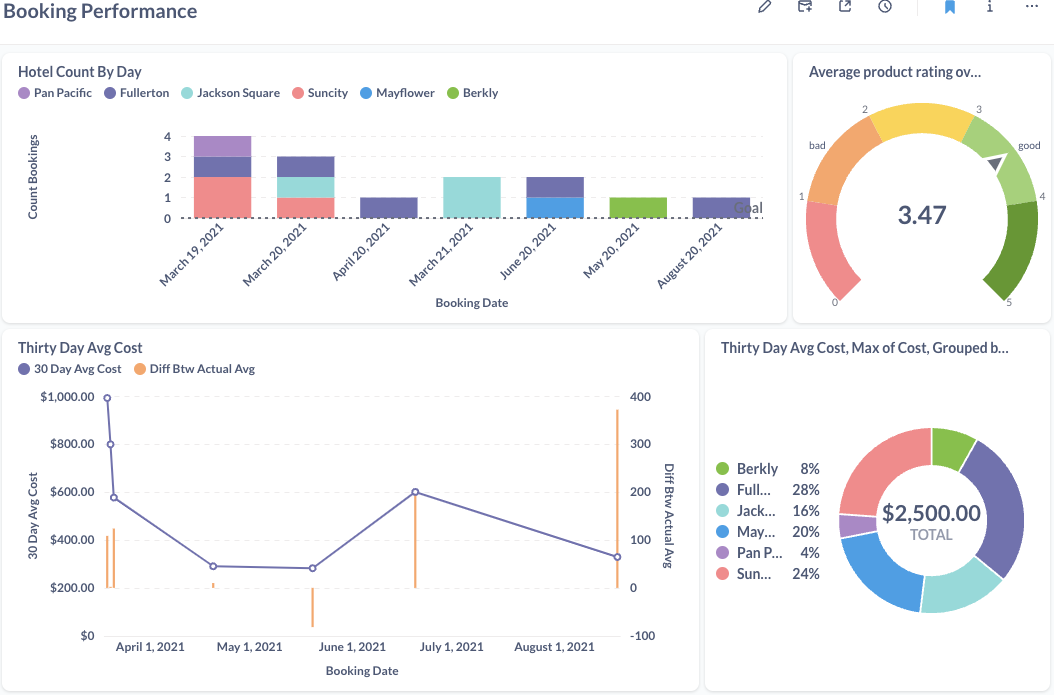
Visualize
Presenting data holds as much significance as the processes of collecting, storing, and analyzing it. Visualizations serve as a catalyst, empowering business users to base their decisions on data-driven insights.
%%{init: {
        'theme': 'base',
        'themeVariables': {
            'primaryColor': '#ffffff',
            'primaryTextColor': '#000000',
            'primaryBorderColor': '#666666',
            'lineColor': '#666666',
            'secondaryColor': '#ffffff',
            'tertiaryColor': '#ffffff'
        }
    }}%%
graph TD
%% Add a transparent text node as a watermark
style Watermark fill:none,stroke:none
Watermark[Created by: LongBui]
    A[Visualization] --> B[Data Presentation]
    B --> C[Significance in Decision Making]

    A --> D[Visualizations as Catalyst]
    D --> E[Empower Business Users]

    A --> F[Quality of Visual Data Representation]
    F --> G[Paramount Importance]

    A --> H[Tailoring UI for Multiple Use Cases]
    H --> I[Challenge of Perfect UI]

    H --> J[Facilitate Creation of Tailored UIs]
    J --> K[Enable APIs for Data Access]
    K --> L[Freedom for Customized Interfaces]

    A --> M[Access Data via UI or API]
    M --> N[Direct Access to Big Data Cluster]

    M --> O[Leverage Analytical Findings]
    M --> P[Utilize Raw Data Seamlessly]
Figure: Visualizing Data technique
Hence, the quality of visual data representation stands paramount. At times, when multiple use cases or projects utilize the same platform, tailoring the perfect user interface (UI) that suits every need might pose a challenge.
In such scenarios, the ideal approach involves facilitating the creation of tailored UIs by enabling others to craft their own. How? By establishing APIs that grant access to the data, allowing developers the freedom to design customized interfaces.
Whether through a UI or an API, the key lies in enabling direct access to the data within the big data cluster at the display stage. This level of access empowers developers to leverage both analytical findings and raw data seamlessly.