Week 6 - Stream Processing
What is Kafka ?
Apache Kafka is an open-source distributed event streaming platform capable of handling trillions of events a day. Originally developed by LinkedIn, Kafka has become a vital component in modern data engineering for processing, storing, and analyzing large volumes of data in real time. It is designed to handle high throughput and low-latency data pipelines, making it suitable for a wide range of use cases.
Kafka Ecosystem Overview: The Kafka ecosystem includes several components that work together to build robust and scalable data pipelines
- Introduction to Kafka Ecosystem
- Introduction to Kafka
- Managing and Evolving Data Schemas
- Building Real-Time Stream Processing Applications
- Integrating Data with Kafka Connect and Querying with KSQL
- Processing Streaming Data
- Handling Late Data
- Starting Kafka 101
- Calculating to Consume Realtime Data
Introduction to Kafka Ecosystem
This diagram shows the full picture of Kafka ecosystem and how to process the data with Kafka
flowchart BT
%% Add a transparent text node as a watermark
style Watermark fill:none,stroke:none
Watermark[Created by: LongBui]
    A[Kafka Ecosystem] -->|Messaging Platform| B[Kafka Broker]
    A -->|Monitoring| C[Kafka Manager]
    A -->|Data Ingestion| D[Kafka Producers]
    A -->|Data Consumption| E[Kafka Consumers]
    A -->|Storage| F[Kafka Topics]
    A -->|Coordination| G[Zookeeper]
    A -->|Stream Processing| H[Kafka Streams]
    A -->|Connector| I[Kafka Connect]
    A -->|Schema Management| J[Kafka Schema Registry]
    A -->|SQL Querying| K[Kafka KSQL]

    D -->|Send Messages| F
    E -->|Read Messages| F
    H -->|Streams Data| F
    I -->|Connects Data Sources| F
    J -->|Manages Schemas| F
    K -->|Performs SQL Operations| F

    F -->|Stores Persistent Data| G
    G -->|Provides Coordination| B
Figure: Kafka Ecosystem Overview
Where Kafka being used in Data Engineering Project?
Apache Kafka has become an indispensable tool in the data engineering landscape, enabling organizations to build real-time, scalable, and resilient data pipelines. With its rich ecosystem and robust capabilities, Kafka supports a wide range of use cases, from real-time analytics to microservices communication, making it a cornerstone of modern data architectures.
graph LR
%% Add a transparent text node as a watermark
style Watermark fill:none,stroke:none
Watermark[Created by: LongBui];
    A[Kafka Ecosystem] --> B[Data Ingestion]
    A --> C[Stream Processing]
    A --> D[Data Integration]
    A --> E[Microservices Communication]
    A --> F[Data Warehousing & ETL]
    A --> G[Log Aggregation]
    A --> H[Event Sourcing]

    B --> I[Real-Time Data Collection]
    B --> J[Event-Driven Architectures]

    C --> K[Real-Time Analytics]
    C --> L[Fraud Detection]
    C --> M[Monitoring & Alerting]

    D --> N[Database Integration]
    D --> O[Cloud Services Integration]
    D --> P[Data Lake Integration]

    E --> Q[Asynchronous Messaging]
    E --> R[Event-Driven Workflows]

    F --> S[ETL Pipelines]
    F --> T[Near Real-Time Data Updates]

    G --> U[Centralized Log Aggregation]
    G --> V[Operational Visibility]

    H --> W[Event Sourcing Patterns]
    H --> X[State Reconstruction]
Figure: Applied Kafka in Data Project
Introduction to Kafka
- Overview: Apache Kafka is a distributed streaming platform designed for high-throughput, low-latency data processing.
- Key Components:
- Producers: Publish data to Kafka topics.
- Consumers: Subscribe to topics to process data.
- Brokers: Kafka servers that store data and serve client requests.
- Topics: Categories to which records are published.
- Partitions: Subdivisions of topics for parallelism.
- Type: Batch Query (Message per Second) and Stream Query (Transaction per Second) Operations
flowchart BT
%% Add a transparent text node as a watermark
style Watermark fill:none,stroke:none
Watermark[Created by: LongBui]
    subgraph broker
    direction LR
    Topic --> Partition
    end
A[Producer] --> |write| broker --> |read| C[Consumer]
Figure: Kafka Process Flow
Focusing on on problems and practices related to Kafka in data engineering.
Managing and Evolving Data Schemas
Apache Avro is a data serialization framework designed for efficient and compact data serialization.
mindmap
  root((Managing and Evolving Data Schemas))
    Challenges
      Complex Schema Management with large scale
      Schema Versioning
    Benefits
      Serialized data, improve speed of processing
      Backward and Forward schema without disrupting
    Schema Registry
      Centralize Schema
      Validate Schema during read&write
      Data Consistent
Figure: How Kafka manage Schema

Challenges and Pain Points:
- Complex Schema Management: Handling schema evolution can be complex, especially with large data systems.
- Schema Compatibility: Ensuring compatibility between different versions of schemas can be challenging.
Use Cases
- Efficient Data Serialization: Useful for high-throughput systems requiring compact and fast serialization.
- Schema Evolution: Ideal for systems where schemas evolve over time, requiring backward and forward compatibility.
Benefits
- Compact and Fast: Provides efficient binary format which minimizes data size and maximizes processing speed.
- Schema Evolution: Supports backward and forward compatibility, allowing changes to schemas without disrupting existing processes.
Schema Registry
- Stores Avro schemas centrally and validates schemas during read and write operations.
- Ensures data integrity and consistency across systems.
Building Real-Time Stream Processing Applications
Kafka Streams is a client library for building real-time applications and microservices that process data stored in Kafka clusters.
mindmap
  root((Building Real-Time Stream Processing Applications))
    Challenges
      Complex Stream Processing
      Stateful operation is risky for realtime analytic with reduce process
    Key Features
      DSL API
      KStreams and KTables
    Common Operations
      Filtering
      Mapping
      Joining
Figure: Use Kafka to build Real-time Pipeline
Challenges and Pain Points:
- Complex Stream Processing: Building and maintaining stream processing applications can be complex.
- State Management: Managing stateful operations in streams requires careful planning and resources.
Use Cases
- Real-Time Data Processing: Ideal for applications needing real-time analytics and processing.
- Event-Driven Applications: Useful for building systems that react to streaming events.
Key Features
- DSL API: Allows defining stream processing logic using a Domain-Specific Language.
- KStreams and KTables: Core abstractions for processing data streams and tables.
Common Operations
- Filtering: Exclude records based on specific criteria.
- Mapping: Transform records into different formats or structures.
- Joining: Combine multiple streams into a single unified stream.
Integrating Data with Kafka Connect and Querying with KSQL
Kafka Connect is a tool for scalable and reliable streaming data between Kafka and other systems.
mindmap
  root((Integrating Data with Kafka Connect and Querying with KSQL))
    Challenges
      Connector Configuration Complex
      Various Data Integration
    Use Cases
      Connect Sources and Sinks
      SQL engine for Kafka
      Real-time insight
Figure:SQL Query Streaming Data With KSQL
Challenges and Pain Points:
- Connector Configuration: Setting up and configuring connectors can be complex.
- Data Integration: Integrating with various data sources and sinks may require extensive configuration and customization.
Use Cases
- Data Integration: Simplifies integration with external systems and databases.
- ETL Pipelines: Streamlines ETL processes by connecting data sources and sinks.
Key Features
- Connectors: Plugins to integrate with a variety of data sources and sinks.
- KSQL: KSQL is a streaming SQL engine for Kafka, allowing SQL-like queries for stream processing.
Challenges and Pain Points:
- Query Performance: Complex queries may impact performance and require optimization.
- Limited Functionality: Some advanced stream processing features may not be supported.
Use Cases
- Stream Processing: Perform data filtering, transformations, and aggregations using SQL-like queries.
- Real-Time Analytics: Enable real-time insights and analytics on streaming data.
Processing Streaming Data
Kafka is used for building real-time data pipelines and event-driven architectures.
mindmap
  root((Processing Streaming Data))
    Challenges
      Real-Time Data Processing
      Scalability with increased data volume and complexity
    Use Cases
      "Event-Driven Architectures"
      Real-Time Analytics
      Centralize Logging System
      "Distributing Alert & Monitoring"
      Communication Channels
    Tools and Techniques
      Kafka Streams
      Third-Party Tools
Figure: Process Kafka Data
Challenges and Pain Points:
- Real-Time Data Processing: Handling high-volume, real-time data streams can be challenging.
- Scalability: Ensuring the system scales effectively with increased data volume and complexity.
Use Cases
- Event-Driven Architectures: Systems that respond to events in real-time.
- Real-Time Analytics: Applications requiring continuous data analysis and processing.
Tools and Techniques
- Kafka Streams: For stream processing within the Kafka ecosystem.
- Third-Party Tools: Integration with tools like Apache Flink, Apache Spark, etc.
Handling Late Data
Handling late-arriving data involves ensuring accurate and complete data processing despite delays.
mindmap
  root((Handling Late Data))
    Challenges
      Process late-arriving data
      Complex handling to order, idempotent, duplication
    Techniques
      Windowing by group event into time windows
      Watermarks by track event time progress
      Reprocessing by re-compute results
    Use Cases
      Event Time Management
      Reprocessing
Figure: Handling Late Data arrived
Challenges and Pain Points:
- Data Accuracy: Ensuring data accuracy when processing late-arriving data.
- Complexity: Managing late data requires complex techniques and handling.
Use Cases
- Event Time Management: Process data based on event time, even when data arrives late.
- Reprocessing: Recompute results or adjust data based on late-arriving data.
Techniques
- Windowing: Group events into time windows for processing.
- Watermarks: Track event time progress to handle late data.
- Reprocessing: Recompute results considering late-arriving data.
Most use cases of Late-Arriving Data in Realtime processing
Certainly! Here’s how you can represent each technique with a sequence diagram.
Windowing (Total T Days Profit)
sequenceDiagram
    participant User as User
    participant PurchaseEvent as Purchase Event System
    participant Windowing as Windowing System
    participant Aggregation as Aggregation Engine

    User->>PurchaseEvent: Make purchase at timestamp t1
    PurchaseEvent->>Windowing: Send purchase event at timestamp t1
    Windowing->>Windowing: Add purchase event to the 1-hour window
    Windowing->>Windowing: Time passes
    Windowing->>Aggregation: Close 1-hour window at t2
    Aggregation->>Aggregation: Aggregate purchase data
    Aggregation->>User: Emit aggregated purchase data for the past hour
Figure: Calculate Total Profit from last t1,t2 day
Watermarks (Last Selling Items Profit)
sequenceDiagram
    participant User as User
    participant PurchaseEvent as Purchase Event System
    participant Watermark as Watermark Generator
    participant Processing as Sales Processing System

    User->>PurchaseEvent: Make purchase at timestamp t1
    PurchaseEvent->>Watermark: Send event timestamp t1
    Watermark->>Processing: Generate watermark for timestamp t1
    Processing->>Processing: Process sales data up to watermark
    User->>PurchaseEvent: Make late purchase at timestamp t2
    PurchaseEvent->>Processing: Send late purchase event for timestamp t2
    Processing->>Processing: Adjust daily sales total for late purchase
    Processing->>Watermark: Update watermark for timestamp t2
Figure: Calculate profit from item selling date at t1,t2
Reprocessing (Last T Day Profit)
sequenceDiagram
    participant User as User
    participant PurchaseEvent as Purchase Event System
    participant Processing as Initial Sales Processing
    participant LateData as Late Data Handler
    participant Aggregation as Sales Aggregation Engine

    User->>PurchaseEvent: Make purchase for Day 1
    PurchaseEvent->>Processing: Send purchase data for Day 1
    Processing->>Aggregation: Calculate initial daily sales for Day 1
    Aggregation->>User: Emit daily sales report for Day 1
    User->>PurchaseEvent: Make late purchase for Day 1
    PurchaseEvent->>LateData: Send late purchase data
    LateData->>Processing: Reprocess sales data for Day 1
    Processing->>Aggregation: Recalculate sales totals including late data
    Aggregation->>User: Emit updated daily sales report for Day 1
Figure: Calculate total profit from last T Day
Starting Kafka 101
Download data code for starting Kafka Ecosystem with Docker-Compose File and Validation Code
Starting cluster
docker-compose up
Command line for Kafka
Using docker exec -it <broker-name>
Ensure you have the log
root@broker:/# kafka-topics --version
5.4.0-ce (Commit:a2eae1986f4792d4)
Create topic
kafka-topics --create --topic streamPayment --bootstrap-server localhost:9092 --partitions 2
Check if you have created the topic successfully
root@broker:/# kafka-topics --list --bootstrap-server localhost:9092 | grep Payment

streamPayment
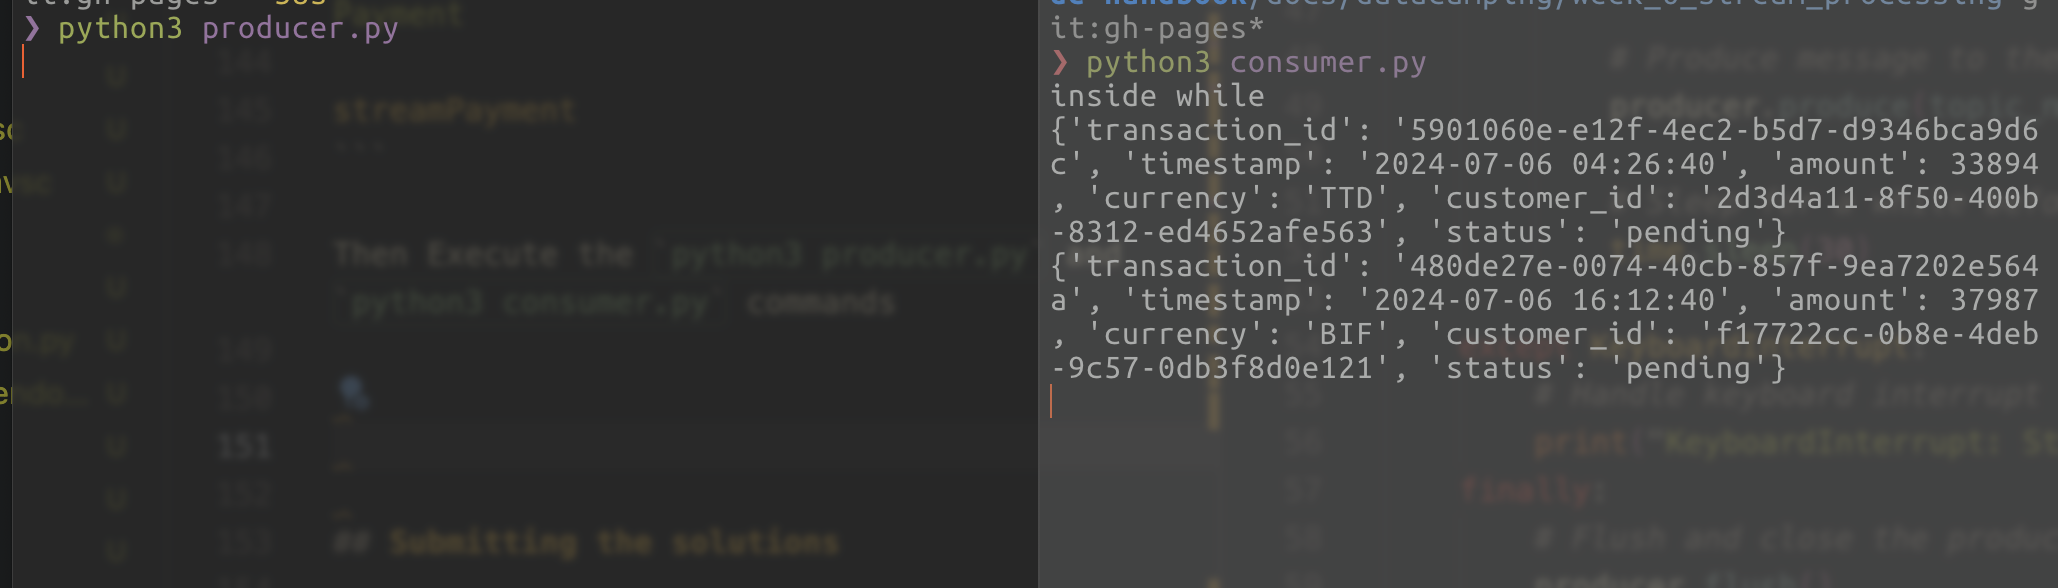
Then Execute the python3 producer.py and python3 consumer.py commands
Calculating to Consume Realtime Data
To calculate the number of topics, partitions, and consumers required for consuming two processes of streaming with the given metrics, breaking it down as follows:
Definitions
- MPS: Messages Per Second
- TPS: Transactions Per Second
- Topic: A category or feed name to which records are stored and published.
- Partition: A way to split a topic’s data across multiple brokers in Kafka.
- Consumer: An application that reads data from topics.
Assumptions
- Message Size: Assume the average size of a message (in bytes). We’ll consider a typical size, e.g., 1 KB per message.
- Throughput Capacity: Assume the maximum throughput capacity for a consumer (e.g., 1 MBps per consumer).
- Redundancy & Replication Factor: Assume a replication factor for data reliability (e.g., 3).
flowchart BT
%% Add a transparent text node as a watermark
style Watermark fill:none,stroke:none
Watermark[Created by: LongBui]
   subgraph Query_Batch_Process
        direction TB
        Topic1[Topic: Query Batch\n10 MPS\nMessage Size: ~1MB] --> Partition1[Partition 1\n10 MPS]
        Partition1 --> Consumer1[Consumer 1\n10 MPS]
    end

    subgraph Real_Time_Process
        direction TB
        Topic2[Topic: Real-time\n10k TPS\nMessage Size: ~1KB] --> Partition2[Partition 2\n1k TPS]
        Topic2 --> Partition3[Partition 3\n1k TPS]
        Topic2 --> Partition4[Partition 4\n1k TPS]
        Topic2 --> Partition5[Partition 5\n1k TPS]
        Topic2 --> Partition6[Partition 6\n1k TPS]
        Topic2 --> Partition7[Partition 7\n1k TPS]
        Topic2 --> Partition8[Partition 8\n1k TPS]
        Topic2 --> Partition9[Partition 9\n1k TPS]
        Topic2 --> Partition10[Partition 10\n1k TPS]
        Topic2 --> Partition11[Partition 11\n1k TPS]

        Partition2 --> Consumer2[Consumer 2\n1k TPS]
        Partition3 --> Consumer3[Consumer 3\n1k TPS]
        Partition4 --> Consumer4[Consumer 4\n1k TPS]
        Partition5 --> Consumer5[Consumer 5\n1k TPS]
        Partition6 --> Consumer6[Consumer 6\n1k TPS]
        Partition7 --> Consumer7[Consumer 7\n1k TPS]
        Partition8 --> Consumer8[Consumer 8\n1k TPS]
        Partition9 --> Consumer9[Consumer 9\n1k TPS]
        Partition10 --> Consumer10[Consumer 10\n1k TPS]
        Partition11 --> Consumer11[Consumer 11\n1k TPS]
    end
Figure: Design Partition for Process Kafka Streaming
Given
- Query Batch Process: 10 MPS (Messages Per Second)
- Real-time Process: 10k TPS (Transactions Per Second)
Here’s the structured table for the calculations:
| Process | Metric | Calculation | Result |
|---|---|---|---|
| Query Batch Process | Total Messages | 10 MPS | 10 MPS |
| Message Size | Assuming 1 KB per message | 1 KB per message | |
| Throughput | 10 MPS * 1 KB | 10 KBps | |
| Partitions Needed | Each partition handles 1 MBps (1024 KBps); Partitions required: 10KBps / 1024 KBps partition | 1 partition | |
| Consumers Needed | 1 consumer per partition (since 1 partition handles 1 MBps) | 1 consumer | |
| Real-time Process | Total Transactions | 10,000 TPS | 10,000 TPS |
| Message Size | Assuming 1 KB per message | 1 KB per message | |
| Throughput | 10,000 TPS * 1 KB | 10 MBps | |
| Partitions Needed | Each partition handles 1 MBps; Partitions required: 10MBps / 1 MBps partitions | 10 partitions |
Consumers Needed: 1 consumer per partition 10 consumers, Separate topics for each process 2 topics (1 per process)
-
Query Batch Process: Total Partitions: 1, Total Consumers: 1.
-
Real-time Process: Total Partitions: 10, Total Consumers: 10.
Additional Considerations
- Replication Factor: If the replication factor is 3, you’ll need to multiply the storage and bandwidth by 3 for redundancy, but this does not impact the number of partitions or consumers directly.
- Scaling: If message sizes increase or the processing speed needs to be faster, consider increasing the number of partitions and consumers accordingly.